Individual Indication Workbook in action
How many treatment-eligible people are in my population?
The Pipeline Analysis and Modeling (PAM) in the NEWDIGS Paying for Cures Toolkit maintains a unique, detailed, indication-by-indication analysis to estimate the expected volume of durable cell and gene therapies (CGT) likely to be available on the US market in the coming years. This indication-specific analysis is available to you in the Individual Indication Workbook. You can use this workbook to calculate the likelihood and scale of treatment-eligible patients in your population for approved and pipeline therapies.
Use case examples
- A commercial payer covering a new gene therapy wants to understand the potential impact of adverse selection in their service area.
- A hospital wants to understand the resource need within their service area for a new gene therapy.
- A self-insured employer wants to know the likelihood of paying for a new cell or gene therapy given the size of their company.
- A developer wants to discuss their product with a payer and how many patients they may anticipate needing the product.
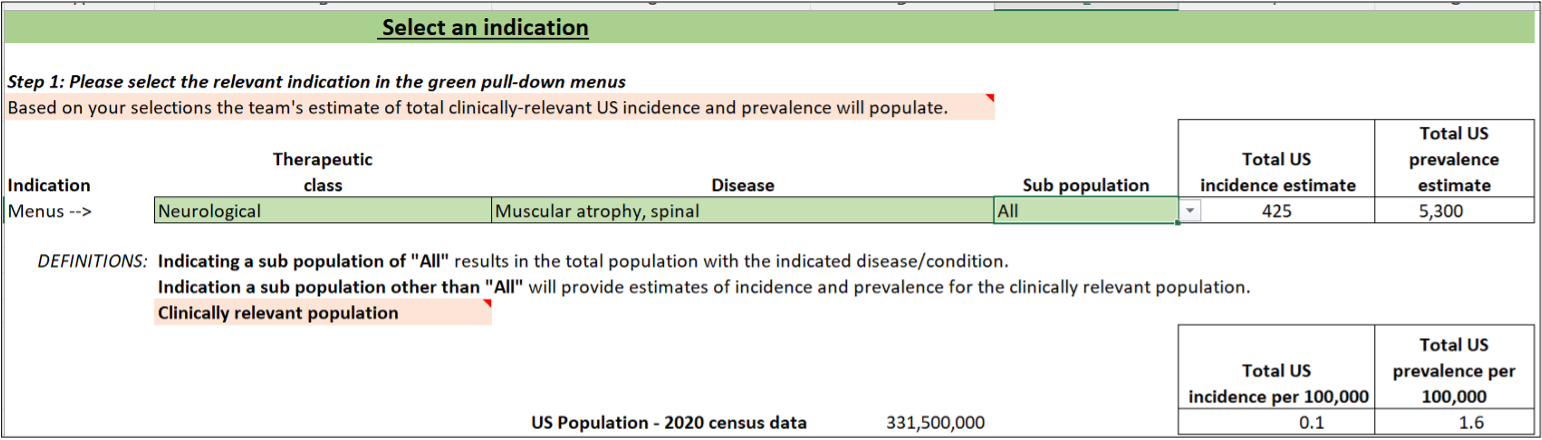
1. PAM provides disease specific incidence and prevalence for the selected disease.
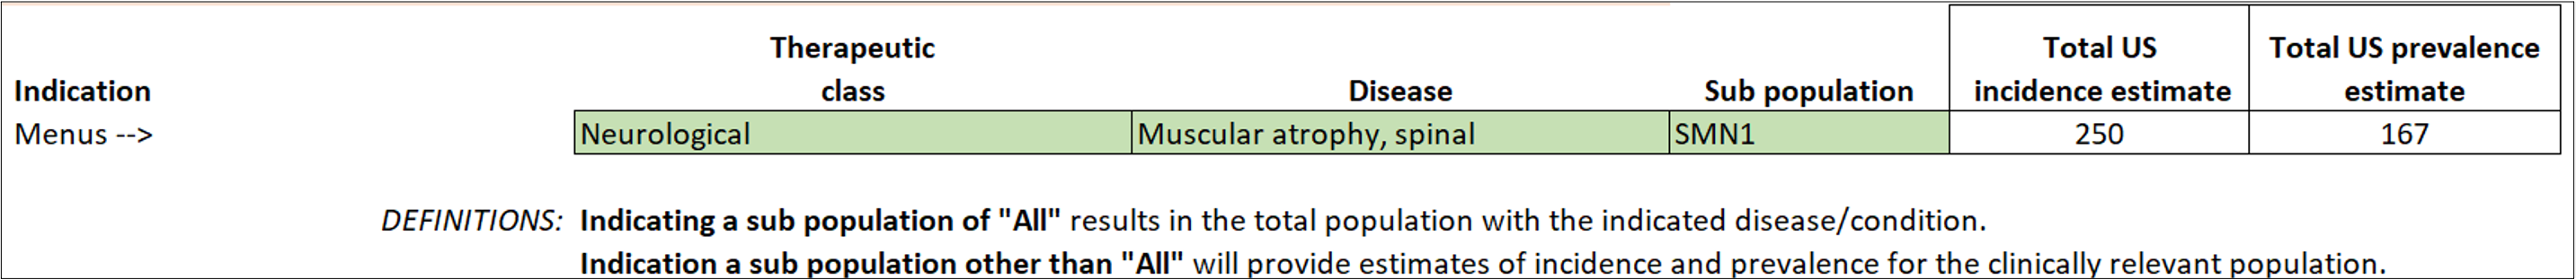
2. The clinically relevant population for CGT is provided when the therapy targeted gene is selected—for example, SMN1.
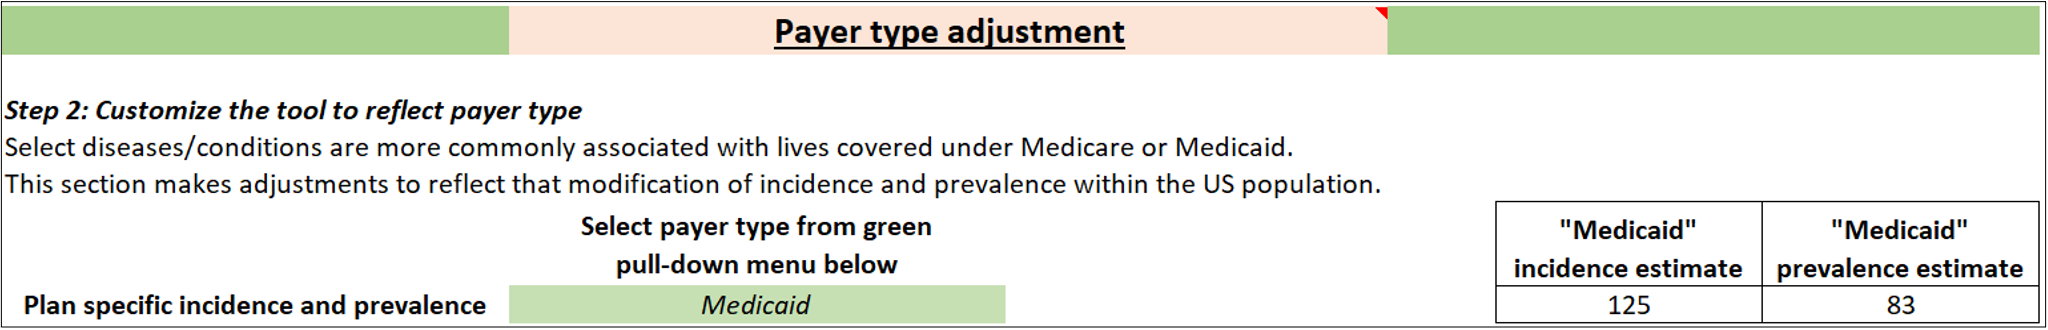
3. The clinically relevant spinal muscular atrophy Type 1 population by payer type is provided when selecting a payer type option.
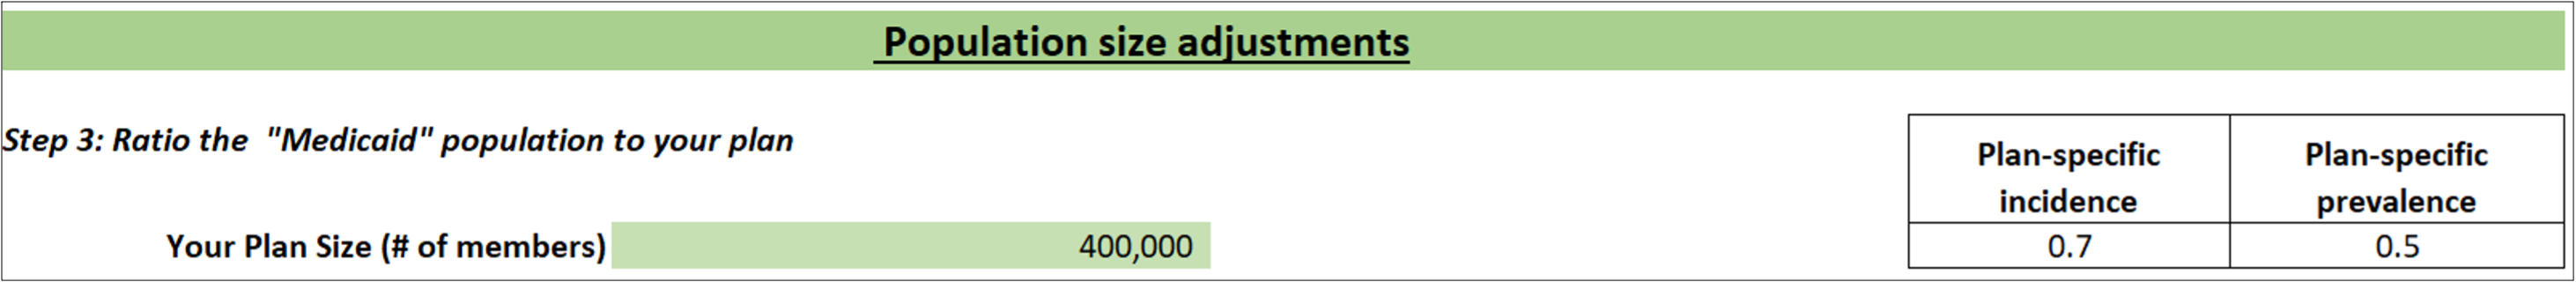
4. Payer may make further adjustments for the size of their population to specifically estimate “How many?” for their plan.