Estimation methodology
NEWDIGS FoCUS undertook a pipeline analysis to determine the scale of the financing challenge of cell and gene therapies (CGTs) in the United States. The figure below illustrates the basic methodology employed.
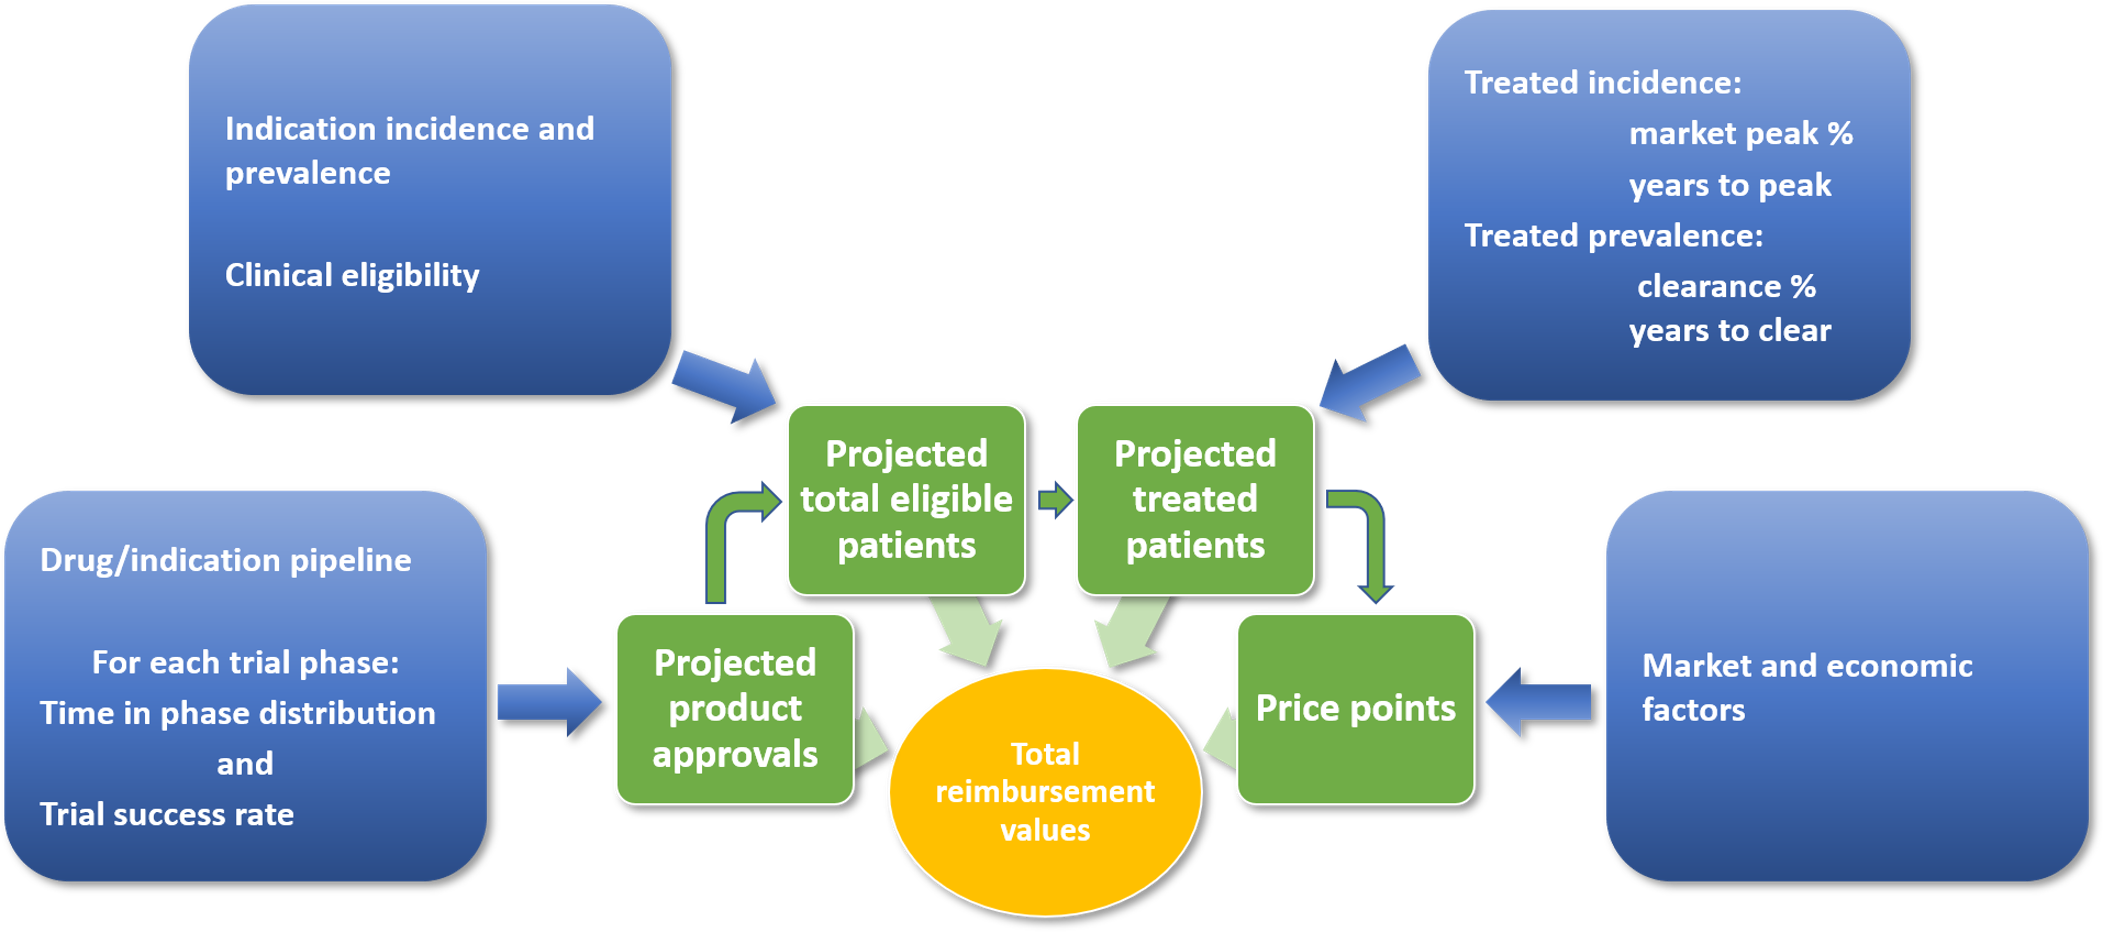
Figure: Schematic of Therapy Launch and Patient Number Estimation
Therapies were identified primarily by utilizing appropriate therapeutic classes and modalities as search criteria in the citeline™ Pharmaprojects™ database. Further therapies were found in the clinicaltrials.gov database using a combination of natural language processing and manual searches and extraction. Clinical trials registered on clinicaltrials.gov were classified where possible for all identified therapies. Only interventional trials with a known status and phase were included. In addition to these therapies, a sample of gene therapies in advanced preclinical investigation was identified from the citeline™ Pharmaprojects™ database for inclusion in our analysis.
Qualifying therapies, all of which are classified as human gene therapy products by the Center for Biologics Evaluation and Research (CBER) and have the potential to produce durable effects beyond 18 months from treatment, fall into the modalities below:
- Gene replacement therapies both in vivo and ex vivo using viral vectors
- T-cell receptors (TCRs) and immune cells engineered to incorporate chimeric antigen receptors (CARs)
- Gene editing therapies:
- Zinc finger nucleases (ZFNs)
- Transcription activator-like effector nucleases (TALENs)
- CRISPR-Cas9 (clustered regularly interspaced short palindromic repeats)
- Long-acting DNA plasmids
We excluded the following on the basis of focusing on durable, potentially curative therapies:
- siRNA therapies delivered naked, via liposomes, nanoparticles, or in bacteria.
- Vaccines
- mRNAs delivered via liposomes or nanoparticles.
- Oncolytic viruses
For use in the modeling process, the remaining data were characterized by product, indication and disease group. Each product-indication was modeled separately in an overall Monte Carlo model.
To forecast the number of product launches, the team applied estimates of the time taken to progress through each level of trials, and probabilities of success (defined as the probability that a product, on completing one level in the trials process, will initiate a trial at the next level) of each trials program. Estimates of the time in phase for clinical trials programs were obtained by examining samples of completed trials. Therapies from the target categories above make up too small a sample size to populate the model parameters for estimating trial durations; therefore, a larger set of cell and gene therapies was used, still restricted to novel, large-molecule therapies. These data were extracted in March 2023. Start dates and primary end dates of individual trials extracted from these data were the basis for estimating each product development program’s time in each phase: i.e. Phase 1, Phase 2 (including Phase 1/2), and Phase 3 (including Phase 2/3). Trials that had not reached a conclusion (completed, terminated or withdrawn) were discarded. From these samples, completion curves were derived for each phase of trials, relating time taken to complete the phase to the number of programs taking that amount of time. These phase-specific distribution functions were used to determine the probability of a phase concluding (successfully or not) in each cycle of the model. The same data set of completed trials, broken down into 4 groups for the purposes of forecasting: hematological cancers, solid tumors, gene therapies for orphan diseases, and gene therapies for higher prevalence diseases, was used to derive probable success rates for each phase of trials.
Two scoping decisions impact our base case estimates of product approvals:
- First, we exclude clinical trials based in China for therapies developed by Chinese companies. We believe these therapies are targeted for the Chinese market and are unlikely to seek a US launch.
- Second, we have excluded pre-clinical development programs. Although these very early stage therapies provide an ‘expanded snapshot’ of the clinical pipeline giving an indication of possible pipeline replenishment, there is a high level of uncertainty concerning their eventual advance to the clinic.
Our model uses a Markov Chain Monte Carlo process; within each iteration of the model, each individual development program was forecast on a year-on-year basis. i.e., in any given cycle
- If a trial is successfully concluded, a new trial at a higher level will be considered to have started
- If a trial is unsuccessful, this terminates the development program
The highest development level that can be achieved is approval.
For each development program the estimated year of approval, should it occur, is noted. Across all iterations the years of approval are summarized to provide probabilities that approval will be obtained in specific years (our results are typically based on 1,000,000 iterations). In contrast to the stochastic Markov chain approach used in forecasting approvals, the subsequent analysis undertaken in each iteration of the model was entirely deterministic.
Population incidence and prevalence data for non-oncology, gene therapy products were obtained through targeted searches of published and online literature on diseases for each disease for which a gene therapy is in our trials pipeline. The team reviewed clinical trial study eligibility criteria carefully to derive as tight an estimate of the expected pool of treatment-eligible patients as possible.
Oncology data were obtained from the SEER database. We defined the treatment-eligible population as those who would not survive 5 years after diagnosis. The most relevant therapies in this analysis are CAR-T and T-cell receptor therapies, which are most likely to be second-line and third-line treatments. Patients who survive longer than 5 years have generally responded well to first-line or second-line therapies. Those with relapsed or refractory disease represent the patient pool who might benefit from CAR-T or T-cell receptor therapies. On average these are about 30% of those diagnosed, although for individual cancers, the proportions range from more than 90% (for lung or pancreatic cancer) to less than 10% (for prostate cancer). The implication of this approach is that the potentially treatable pool in oncology (those determined to be relapsed or refractory in a particular year) is entirely incident—there is no prevalence.
In the case of approval, data on treatment-eligible incident and prevalent patient populations, together with projections of the penetration rate for the product, were used to estimate the potential number of patients on a year-by-year basis.
Once launched, new products will have market penetration established on the basis of adoption, which comprises 2 factors: the maximum penetration rates achieved for incident cases, including the time taken to reach that ceiling, and the maximum proportion of prevalence cases to be “cleared,” and the time taken for treatment of those living with the disease. In diseases with poor prognosis (e.g., aggressive cancers), there will be very little backlog because few patients survive.
Adoption for both incident and prevalent cases was characterized using a Bass diffusion model, which captures how ‘innovators’ and ‘imitators’ combine to determine overall adoption of a new technology. Factors considered in parameterizing adoption included disease severity (life expectancy, quality of life, and availability today of alternative therapies), economics (cost of existing standard of care therapies and Medicaid or Medicare reimbursement policies), and friction between various stakeholders that might reduce or slow down uptake, or reduce reimbursed patient populations.
Adoption and market penetration will not be known reliably for some time for CGTs. In addition to insufficient real-world data, historical data make a poor foundation for forming assumptions because they will not include CGTs. Our base case was constructed from analysis and assumptions for each indication; the base case of the model is therefore an aggregation of base-case settings for each indication. The differential penetration rates for incident and prevalent cases reflect a decline based on access restrictions, patient deaths, or other factors that reduce eligibility. The explicit access restriction of all erstwhile eligible patients is a limit on access that reflects (1) access restrictions (e.g., by payers, but also clinician prescribing, etc.) and (2) likely narrowing of indications relative to what were broad indications listed in clinical trials databases.
To derive potential total expenditures, estimated patient numbers were multiplied by estimated price/patient treated. Prices were assumed to be $2,500,000 per medicine for ultra-orphan diseases, $800,000 for orphan diseases, $500,000 for higher prevalence conditions, and $400,000 for CAR-Ts and TCRs (cancer therapies). For certain high prevalence conditions with a low cost SoC, prices of $100,000 or $50,000 are assumed. These figures will be adjusted periodically to reflect market-based pricing information as more gene therapies gain approval and are launched.
For each condition, treatment eligibility is broken down into Medicare, Medicaid and “Not Medicare or Medicaid”. Medicare eligibility is assumed to be those over 65 years of age (approximately 55 million) plus those who have qualified through the Social Security Disability Insurance program (a little over 8 million). Medicaid eligibility consists of Medicaid plus CHIP less those dually eligible for Medicare and Medicaid. (We note that Medicaid enrollment grew by approximately 17% between February 2020 and May 2021. Our total of just over 70 million reflects mid-year 2020.) “Not Medicare or Medicaid” eligibility is total eligibility less those ascribed to Medicare and Medicaid.