Individual Indication Workbook in action
How many treatment-eligible people are likely to treat and how long before they treat?
The Pipeline Analysis and Modeling (PAM) in the NEWDIGS Paying for Cures Toolkit provides an indication-by-indication analysis to estimate the number of patients meeting the FDA label treatment criteria. But how many are likely to be treated? Numerous factors beyond treatment eligibility will influence a product’s use. You can use the PAM workbook to learn the expectations for “likely to treatment” numbers made by NEWDIGS researchers and modify results based on your expectations.
Use case examples
- A benefits consultant wants to use NEWDIGS researcher’s treatment adoption expectations to advise on benefit and payment strategies for a new CGT.
- A finance director wants to prepare a multi-year plan budget using various treatment adoption scenarios vis-à-vis a prevalent populations’ likely treatment with a new gene therapy.
- A hospital wants to anticipate potential patient volume over the next 5-10 years based on specialized gene or cell therapies.
The Market Adjustment tab of the Individual Indication workbook addresses market penetration and timing for market uptake or adoption. The workbook provides guidance default numbers for the number of patients likely to be treated. The workbook also provides Indication specific adoption variables for your consideration in defining within the orange boxes, your own modifiers to the total incident and prevalent population likely to be treated. Estimates of those likely to be treated are based on factors such as disease severity and alternative treatments. There are key questions to help you with determining the modification of those eligible to treat to those likely to be treated.
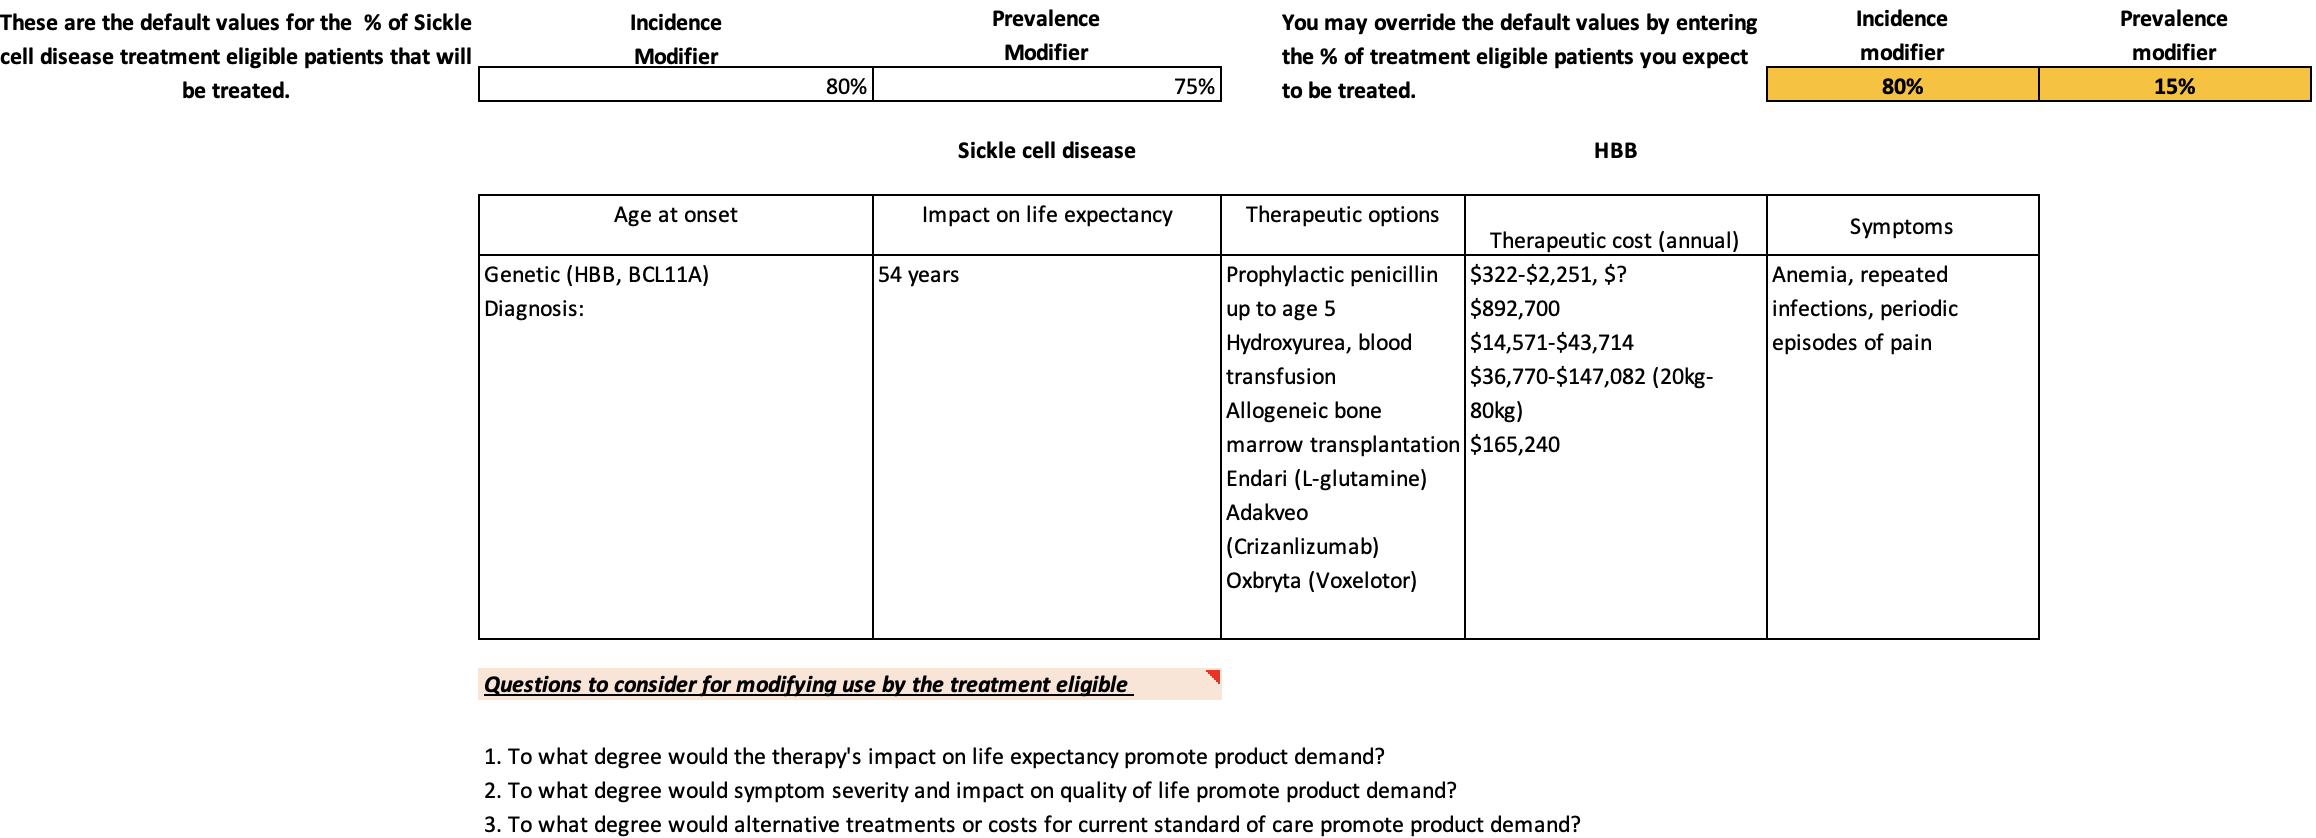
The table below illustrates how from a prevalent population of approximately 35 patients eligible for sickle cell gene therapy is adjusted to 26 (default value) or 17 (end-user value) when modifying for the percentage of patients likely to treat in a Medicaid plan population of 300,000.
|
Total Eligible pop |
NEWDIGS Estimated “likely to treat” |
End-user estimated “likely to treat” |
|
|
Plan specific incidence |
2.7 |
80% = 2.2 |
80% = 2.2 |
|
Plan specific prevalence |
34.6 |
75% = 26 |
50% = 17.3 |
How quickly those “likely to treat” access the treatment is evaluated in the Market uptake/adoption section of the Market Assessment tab. Uptake will vary based on a variety of factors including product production, insurance coverage, provider availability, patient trust, etc. PAM defaults to 100% treatment in year 1 for both incident and prevalent populations likely to treat. However, you can make modifications by entering data in the orange cells.
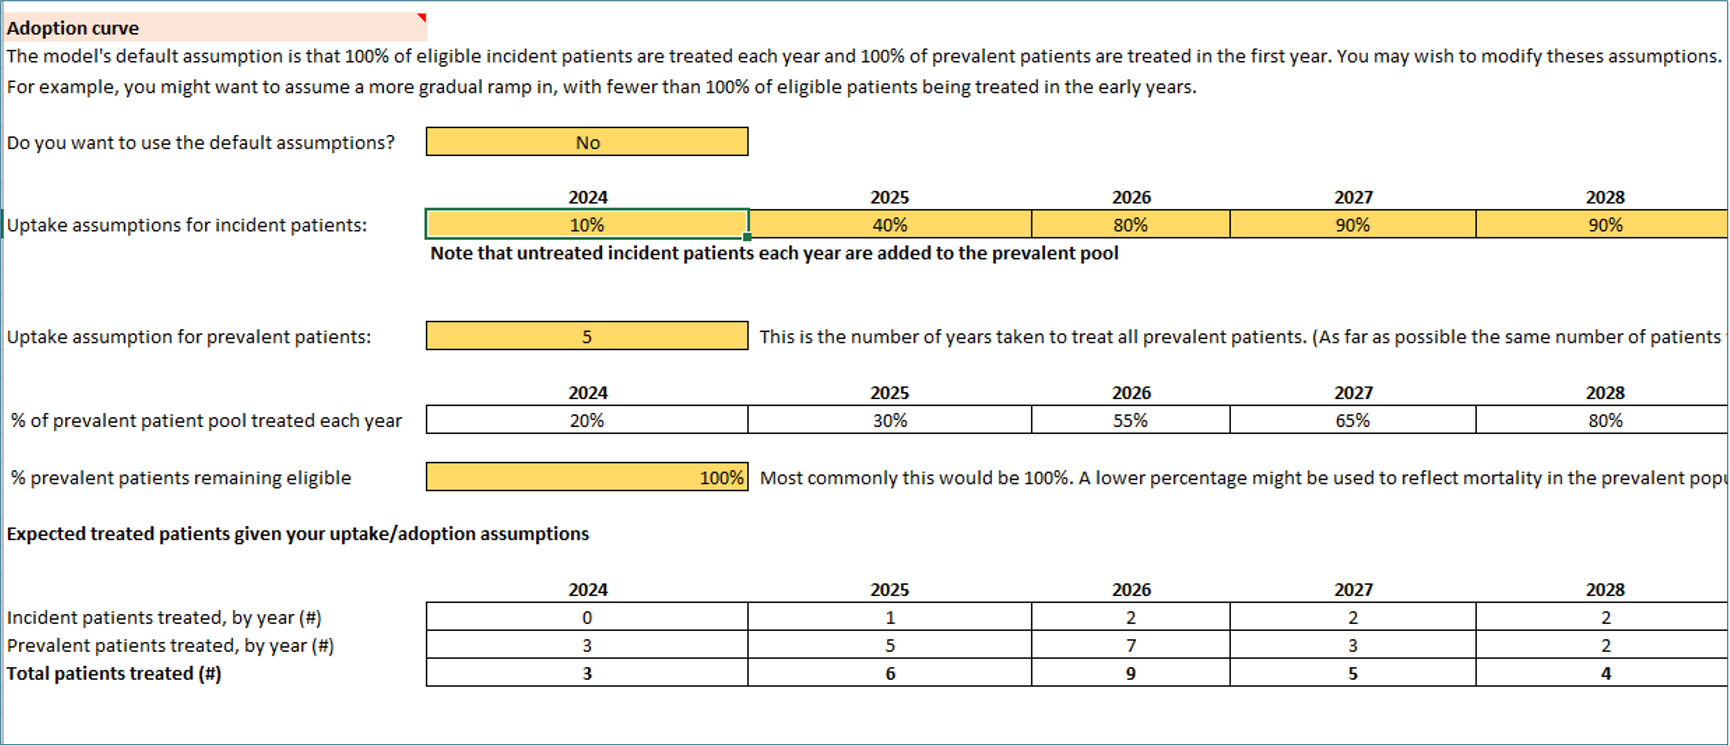
Continuing our example of a 300,000 life Medicaid plan, the treatment adoption rate for incidence patients is set in the orange boxes. The uptake assumption to treat for prevalent patients “likely to be treated” is set as the number of years to treat all prevalent patients. The table below presents the different projections of treated patients based upon prevalent patient uptake assumptions of 3 yrs., 5 yrs., and 7 yrs. (maintaining incident uptake assumptions as presented above). Once all prevalent patients are treated, the Medicaid plan may expect 2 incident patients per year. Use of the Market Assessment tab helps quantify the potential treatment impact to answer questions such as:
1. What is the financial impact of three years of patient treatments costing 6 – 9 times $X?
2. What is the financial impact of multiple years of treatment costing 5 times $X?
