Customizing the pipeline numbers
The NEWDIGS FoCUS Pipeline Analysis Model is available for public use. Projections specific to your organization type and size regarding the cell and gene therapy (CGT) pipeline may be generated from the Pipeline Workbook. Indication assessments based on a CGT and its targeted genes may be assessed with the Individual Indication Workbook. You can access greater details on how to use these workbooks with the resources found in the sidebar.
Individual Indication Workbook
There are four worksheets in the Individual Indication Workbook:
- Population Estimator
- Market Adjustment
- Therapy Impact
- Solution Prioritization
The Population Estimator Tool can help you see what conditions are currently included in this pipeline or understand how many patients we estimate will meet the criteria for treatment for a particular indication if a product successfully completes clinical trials.
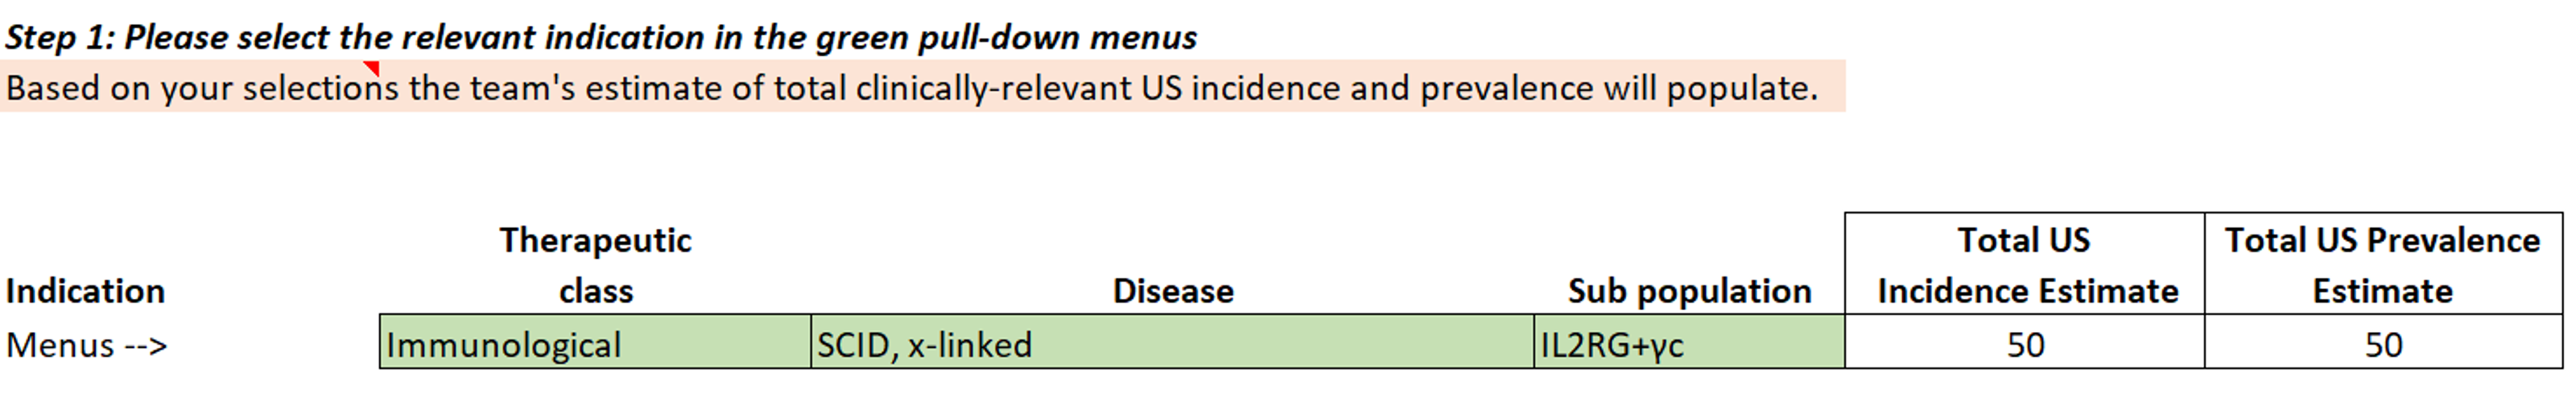
The Population Estimator Tool allows you to select the therapeutic class (e.g., immunological), the disease (e.g., Severe combined immunodeficiency disease or SCID, x-linked), and the sub-population, which is often a genetic marker. It then gives you an estimate of the number of patients (incidence and prevalence) that may be treatable with products currently in clinical trials.
The Population Estimator tool also allows for further segmentation by payer type.
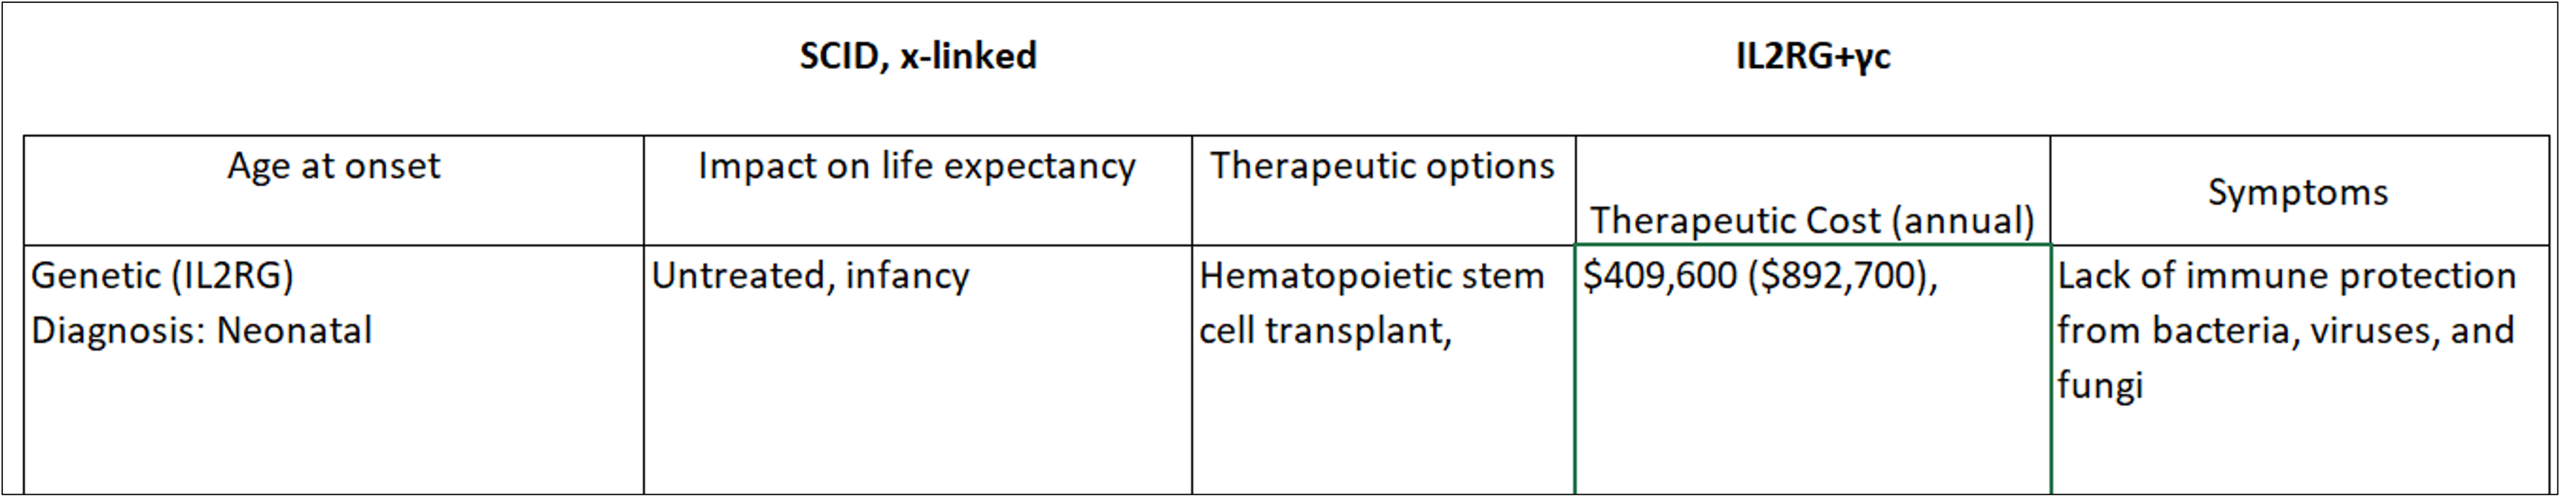
The Market Adjustment Tool addresses assumptions of market penetration and adoption. The tool presents a summary of data that is most influential to market penetration and adoption. Upon reviewing this data, the workbook user may alter the rates of market penetration and/or adoption. Factors influencing the adoption of therapies for SCID, x-linked, are below.
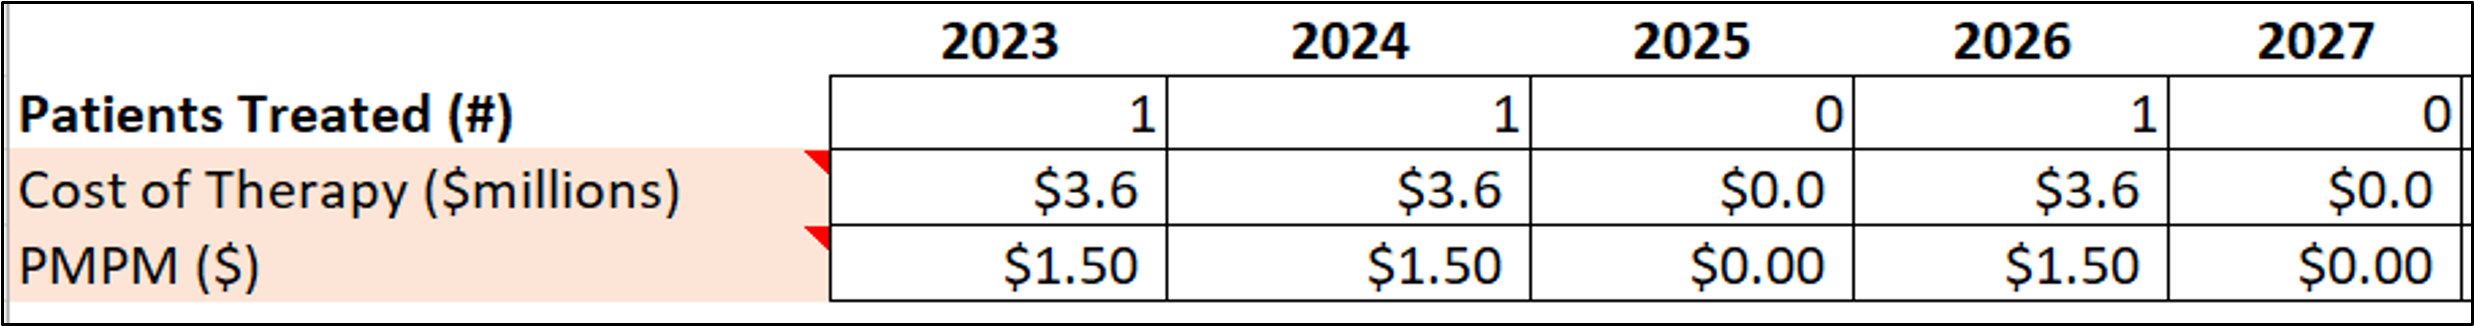
The Therapy Impact Model worksheet provides the financial impact of treatment as a PMPM cost to a payer based on assumptions of cost, market penetration and adoption, and treatment-eligible population. The impact of a therapy costing $3.6M is illustrated below for a 200,000-life payer.
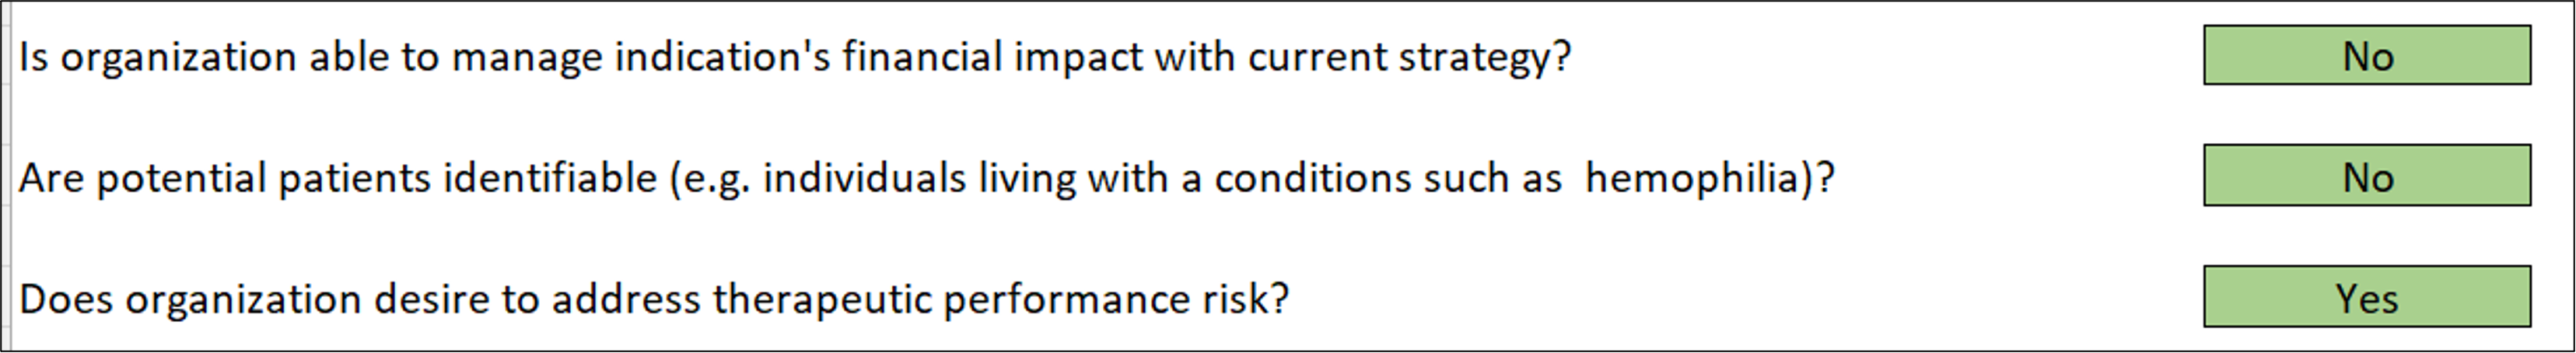
The Solution Prioritization Tool asks several questions to help an organization assess its financial strategy for the impact of a new CGT product coming to market. The tool aligns answers to these questions with the financial tools best suited for the situation.
Pipeline Estimator Tool
The Pipeline Estimator Tool shows impacts of the pipeline on the US market, market segment or a particular payer plan. Detailed literature reviews are conducted for ‘best estimates’ of the eligible patient populations associated with the clinical trial criteria of pipeline therapies. The tool projects product prices based on current gene and cell therapy products in the market.
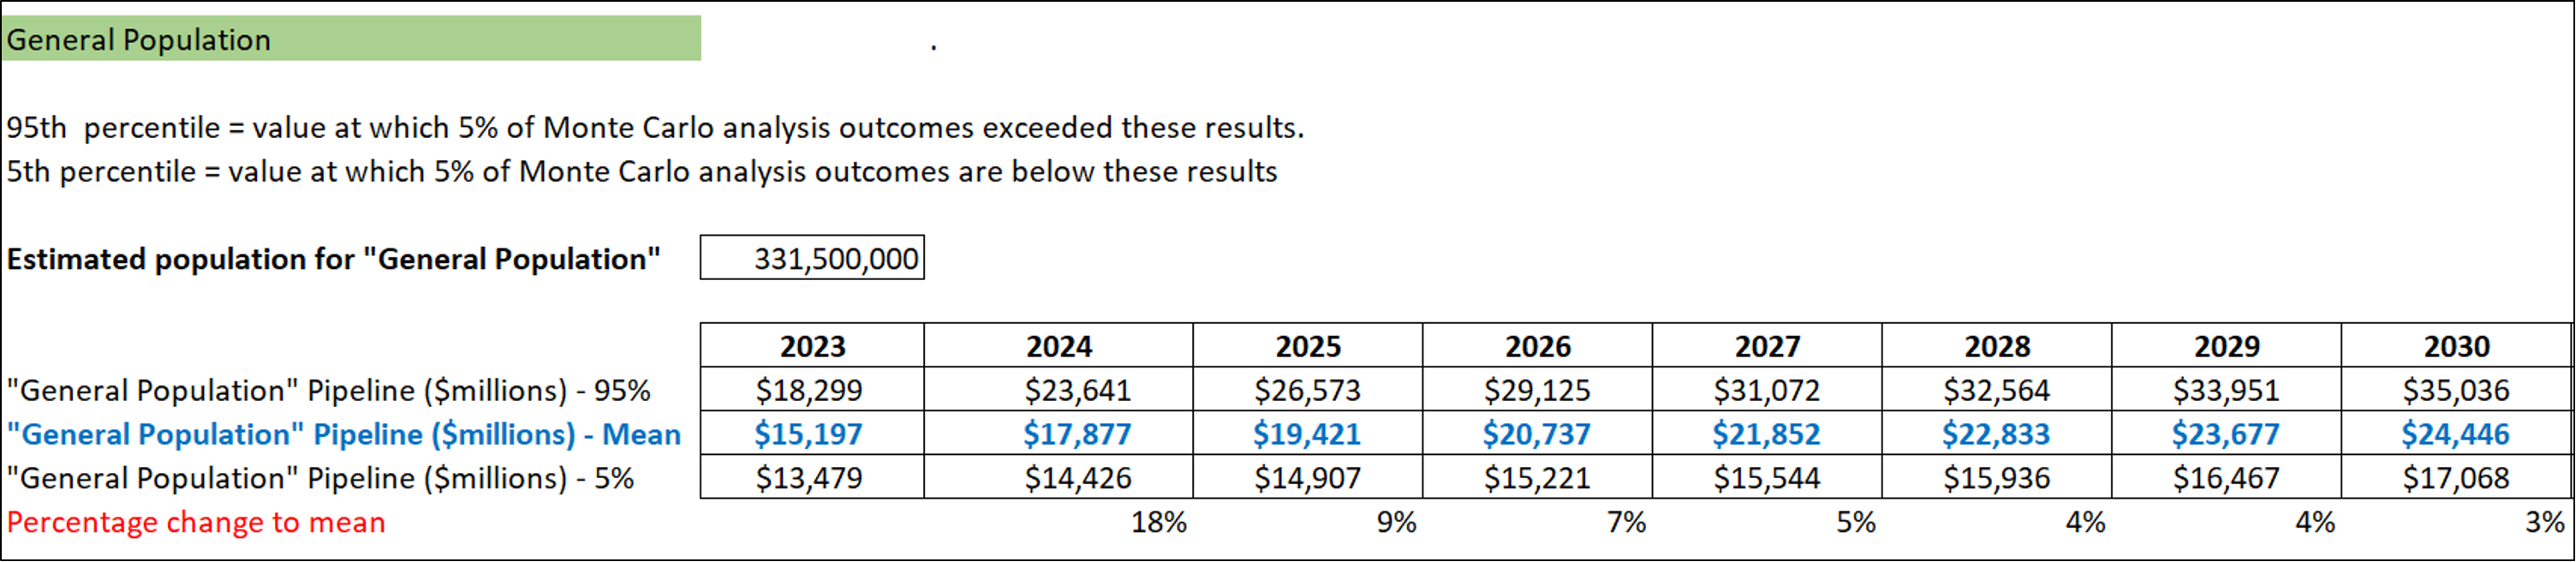
The pipeline tool enables the user to break down the General Population (US 2020 Census) data into segments of Medicare, Medicaid, and Not Medicare or Medicaid to best match the users' plan type. This tool incorporates trends for certain conditions within population segments; for example, Medicare plans will likely see a larger share of the oncology cell therapies, while Medicaid plans will see a larger share of treatments to address genetic conditions that manifest in childhood.
Please note: Use of the Paying for Cures Toolkit website and its planning tools is subject to our Terms and Conditions.